

The innovative iris graphics engine brings a host of new functionality all from within the already versatile VIC-2D and VIC-3D software.
Some of the powerful features include:
Import finite element data for visualization and comparison to measurement data into the new graphics framework
Display synchronized analog data values alongside data plots
Create animations using integrated adaptive motion blurring for fast-moving objects
Animate object position, scale, opacity, rotation, and more with an all-new user-friendly interface
View speckle images on 3D plots
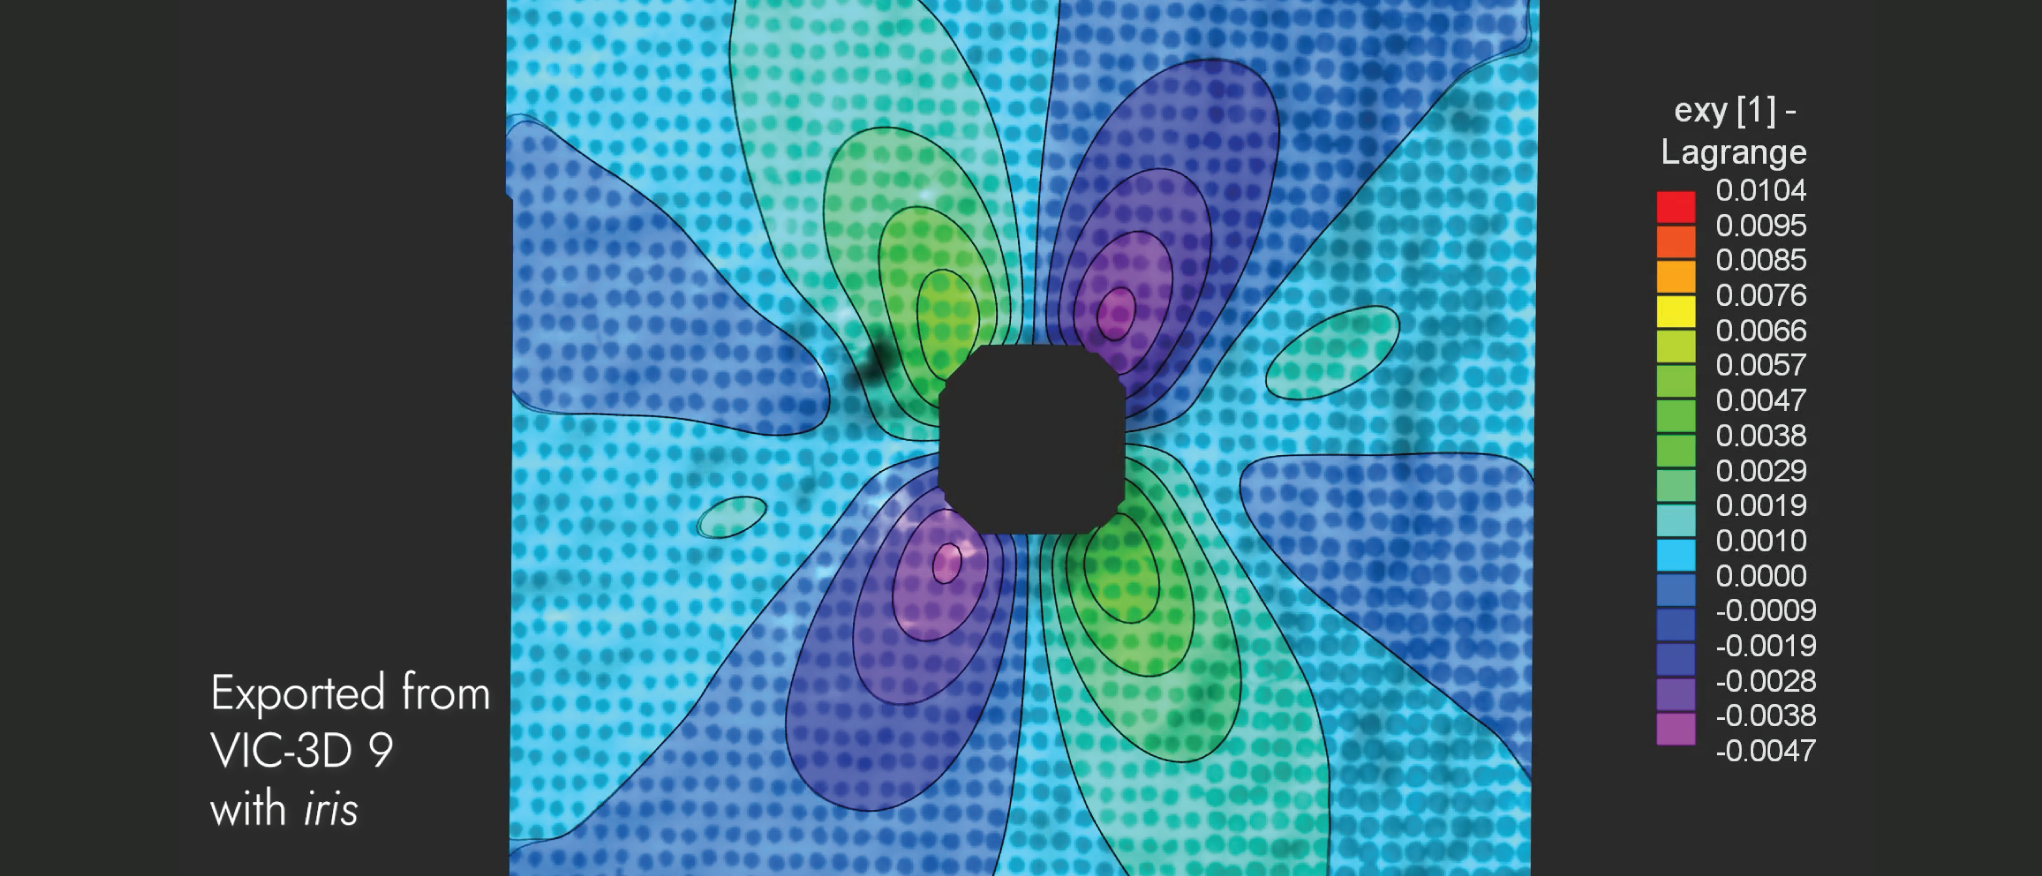
View high-resolution isolines on 2D and 3D plots with scalable fonts
Create high-resolution, publication-ready plots in PDF and ultra-high-definition video formats (from 720p to 4K)
Export high-quality videos in record time using a multi-threaded rendering engine
Edit labels with Unicode support

Marker Tracking in iris

Text boxes with animating variables; speckle pattern on 3D plot; running extraction plots

Iris project templates for quick creation of powerful and repeatable presentation videos. Create your own or use one of the many provided.
Watch this informational video about iris